Year By Year Portfolio Stats

First, let me tell you why I am posting this.  When I am reading other sites, it helps me see how they did it with real numbers.  It triggers something inside me and it just makes it more real or doable.  I wanted to add to that community.  I hope this helps you see that it can be done and triggers action for you like it did for me when reading the other sites.  In other posts, I will detail some instructions on how to do it.  I have some dividends rolling in later this week so I can show you the what that looks like.

Summary Since Inception – 4/26/2012

Savings$363,229.35
Change in Value$404,870.27
Value$768,099.62
Total Dividends$81,531.46
Rate of Return Since Inception18.36%

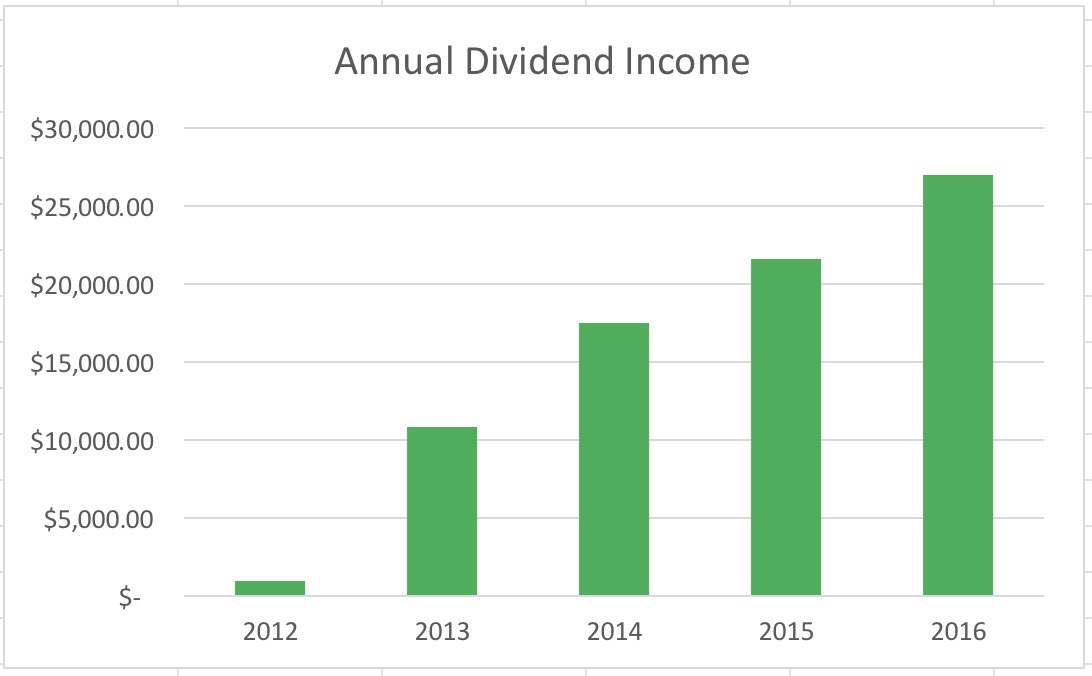
As you read below, I really want you to pay attention to the dividends each year.  Dividend growth is really what we are after.  I’d honestly prefer the stocks I hold  to have gone down so I could buy more shares to throw off more dividends.

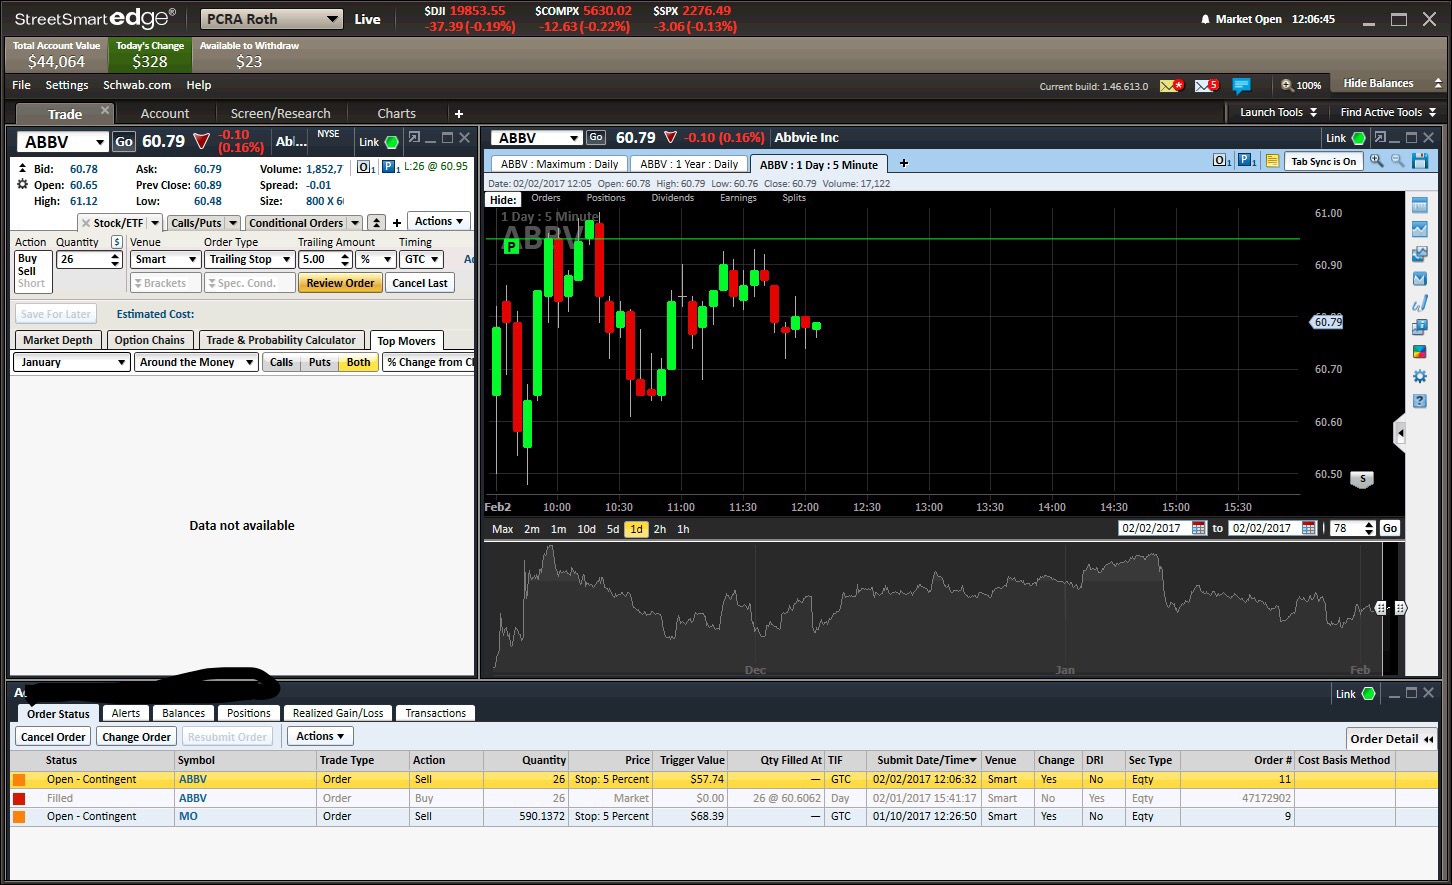
Keep an eye on the “Since Inception” column each year.  The chart (with yellow and black lines) at the bottom of year shows savings (black) charted with portfolio value (yellow).  Portfolio value = stock price X number of shares.

Click on each picture to see larger one.

Terms

Dividends Not Reinvested – Dividends I received, but did not reinvest.  Probably because I forgot to check the “reinvest dividends” when I bought the stock.  I was still learning the mechanics.
Net Cash In/Out – Money transferred in or out from another brokerage account.
Net Transfers In/Out – Savings or withdrawals of money.  I’ve done both over the last 5 years.
Account Value Appreciation/Depreciation – Amount the stock in the accounts have gone up or down based on stock market returns.  Does not include dividends.
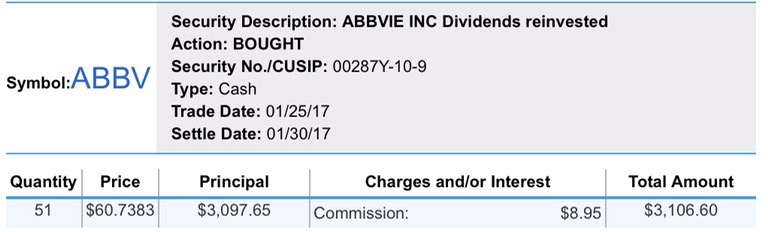
Dividends Reinvested – Dividends we received and reinvested.
Interest Reinvested – Gains from cash sitting in account.  Pays like .01% money market rate.  Terrible.
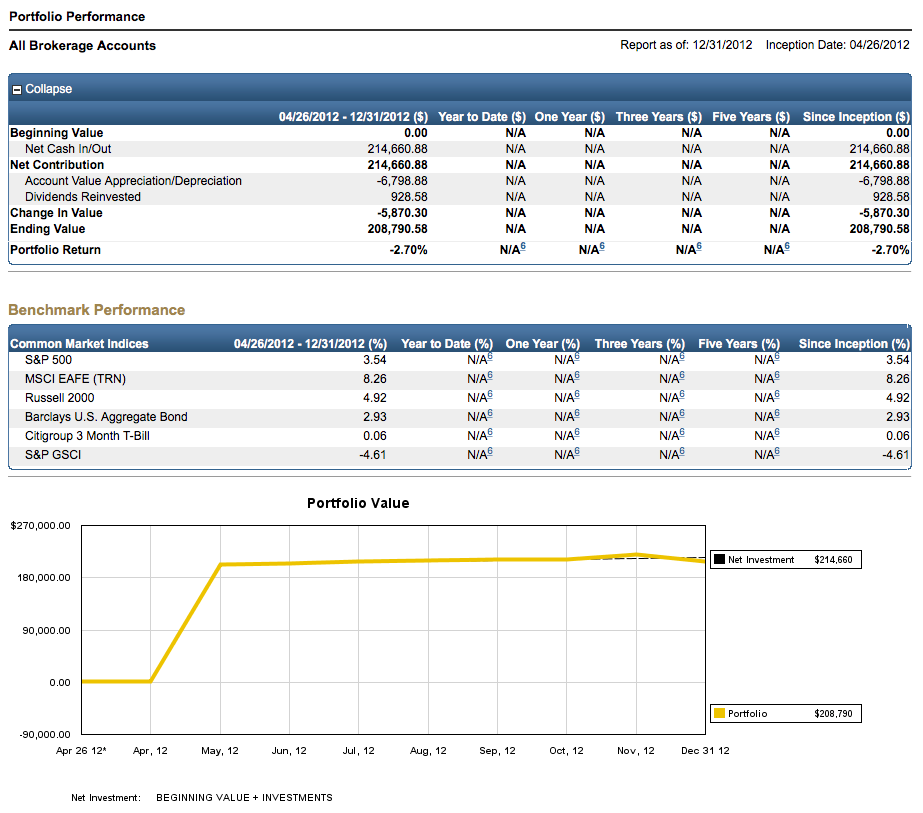
2012

A couple people at work told me about an option we had to self direct our 401k.  Basically, we can buy mutual funds and individual stocks.  Individual stocks pay dividends.  I start moving money in.   Dividends recieved: $928.58.  Exactly $77.38 a month.
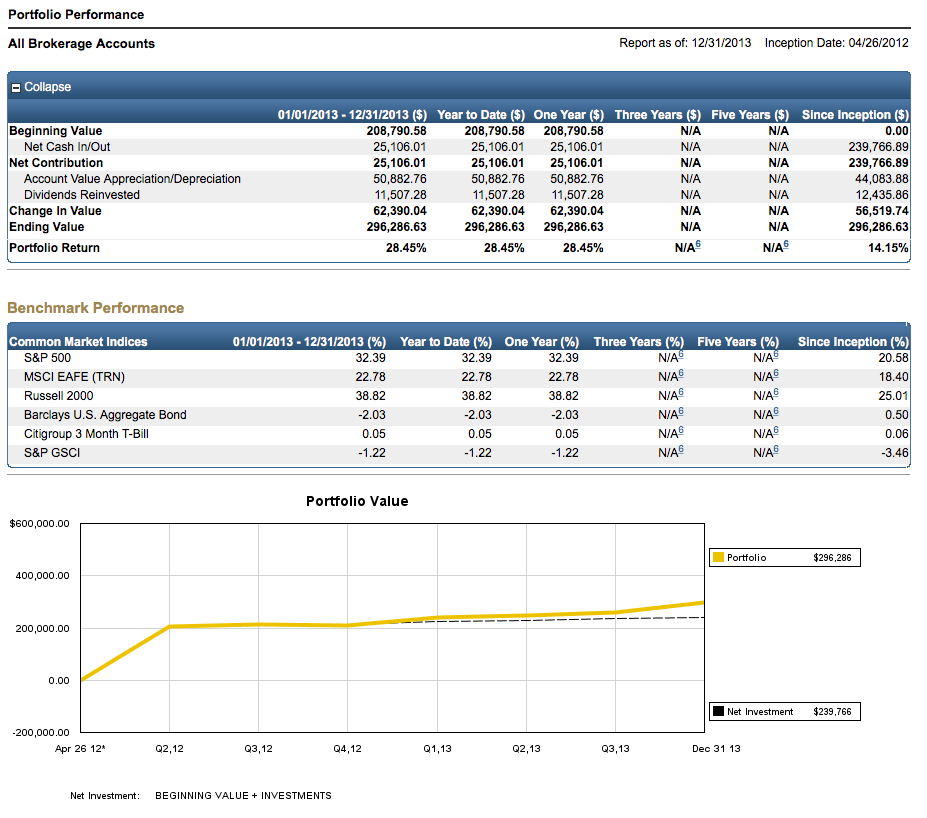
2013

A really good year for the market.  I lost to the S&P 500 this year 28.45% to 32.39%.  I’ll still take 28.45% for any year.  Dividends recieved: $11,507.28.  Almost $1,000 a month.

2014

I flat out whipped the S&P 500 this year, 26.80% to 13.69%.  The portfolio is really starting to take off now, yellow line separating from black line.  I really like the brokerage firm I’m using so I consolidate all other accounts shown on the Net Transfers In/Out line, transferred  $108,354.17.  Mentally, I also really like being able to see the entire stash all in one place.  Dividends recieved: $18,416.53.  Over $1,500 a month.

2015

I don’t know what to even call what I did to the S&P 500, 21.32% to 1.38%.  Killed it! Notice the drop on the black line below.  We had to pull out $43,328 for a relocation that did not work out.  I’m pointing out that life happens.  I also realize that we could pay for something like college from here and still see an increase in the stash.  Dividends recieved: $23,660.12.  Almost $2,000 a month.
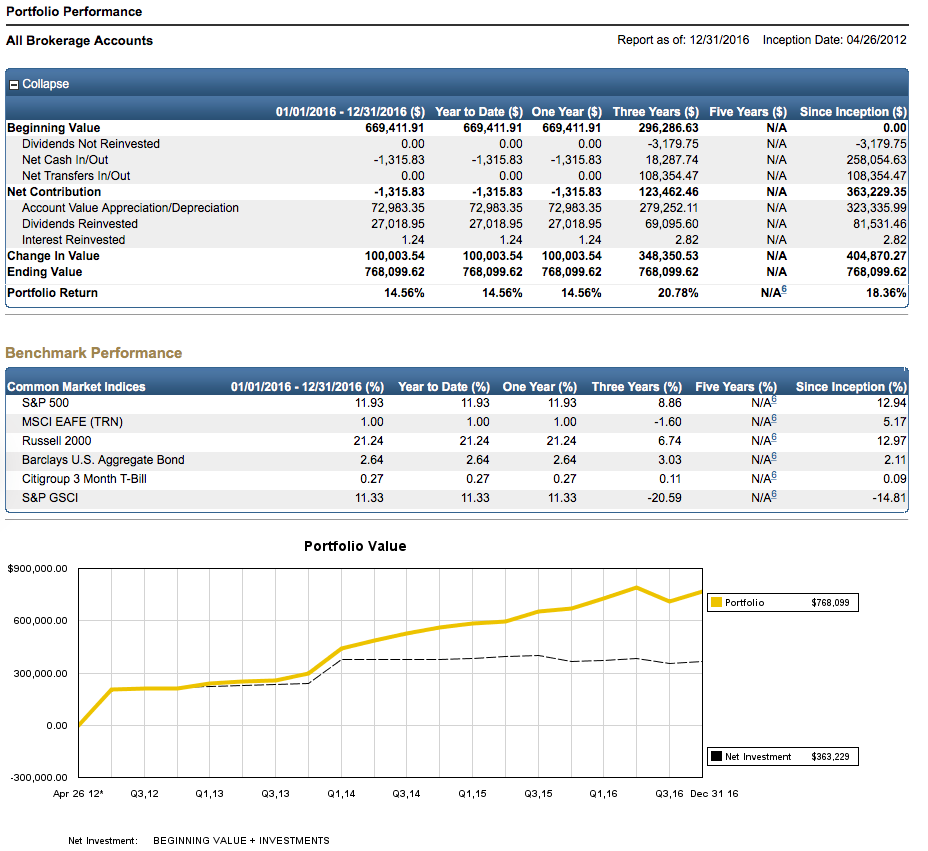
2016

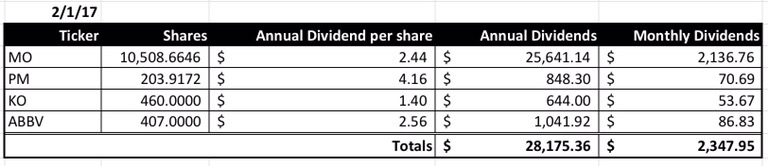
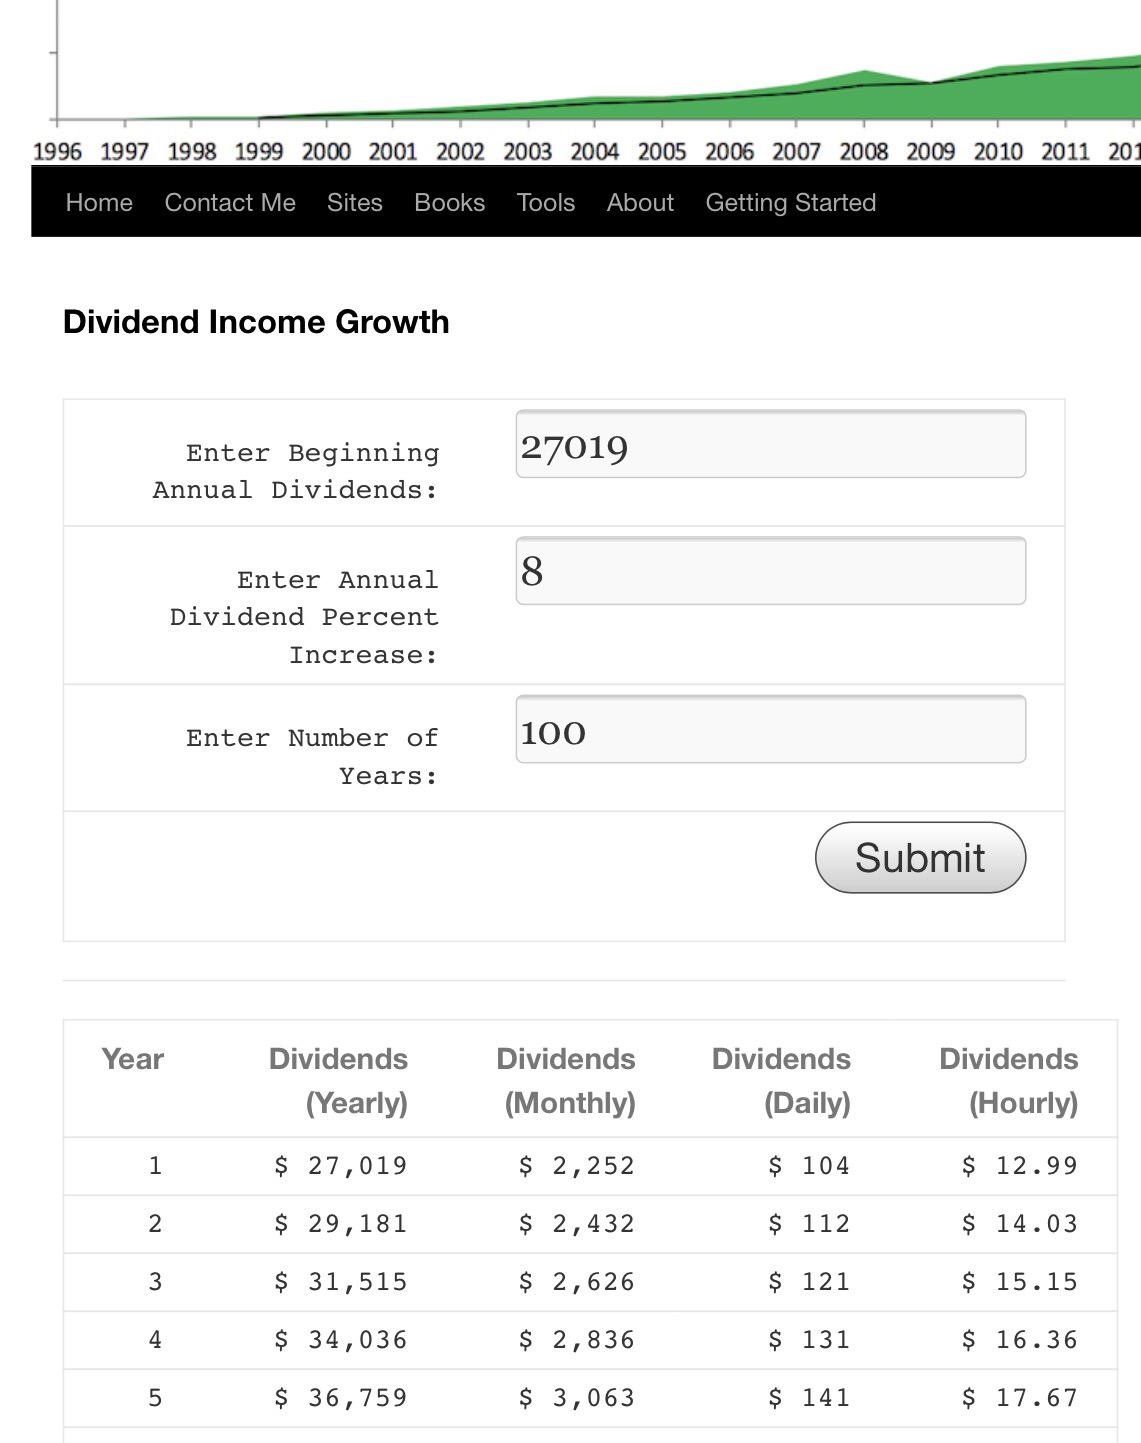
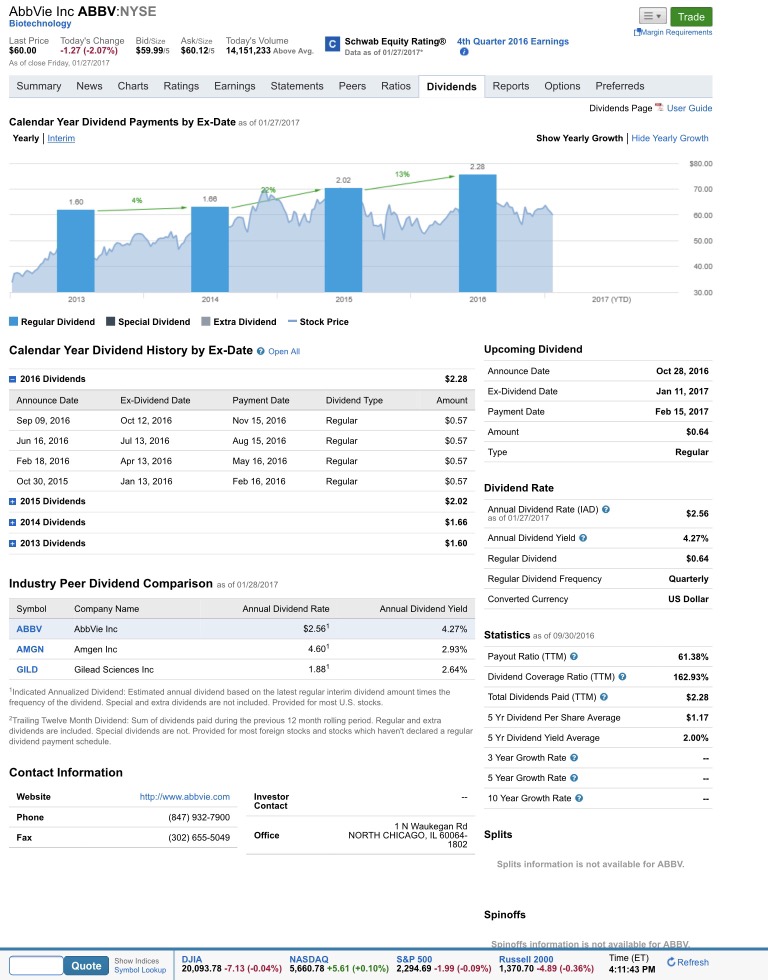
Beat the S&P 500 a little bit, 14.56% to 11.93%.  I strayed away from my fundamental investing approach and got killed.  I won’t do that again.  We also pulled out $33,000 to pay off 2 cars.  I thought I hated letting go of part of the stash more than debt.  I was wrong.  We hate debt more than pulling money from the stash. Especially, after writing the checks each month for about 18 months.  The dip in the 3rd quarter was due to one of my holdings getting clobbered.  I did not sell it and you can see that same holding finished off the end of the year strong.  Reinforces the “think long term” philosophy. Dividends recieved: $27,018.95.  Exactly $2,251.57 a month.   Dividend growth is slower due to my straying from core investing philosophy and one of my holdings is going up, so it’s costing me more to buy more shares.

Thanks for stopping by and I hope you found the post helpful.

Posted in Financial Independence, Net Worth, Our Story | 3 Comments

Taxes, Avoid Them If You Can

Old joke:  Two tax advisers meet for drinks after work. The first one says, “What’s the difference between tax avoidance and tax evasion?” The second one answers, “Ten years in jail.”

But seriously, you work very hard for your money and should do anything legally you can to avoid paying taxes that you don’t have to.

I first started to look into a way to limit my family’s tax exposure in 2012 when I heard Mitt Romney made like $20 million and hardly paid anything in taxes.  Now at that level of income/wealth, I’m sure he is doing all kinds of tax avoidance based on recommendations from his tax team of advisors.  First thing I did was pull out the tax tables and look at them.  At the highest rate, investment income is taxed at about half of what regular income is (20% vs. 39.6%).  I don’t know about you, but I certainly do not like the idea of making more from my salary only to have the government take a higher percentage.

The left side is the income tax you pay on income you earn.  This is the income you work hard for.  You are trading your time for money.

The right side is the income tax rate you pay on long term investments and qualified dividends.  This is the income you have planned and saved for.  Once built up, it does not require you to trade your time for money.  This income is generated whether you are working or not.  You want this type of income to be Financially Independent.

For simplicity sake, assume the $75,299 is after any deductions and/or tax credits.  That means you can actually make more than $75,299 since you will either get your standard deductions or itemized deductions and/or tax credits.

Left side, If a married couple was working hard and trading time for income and made $75,299, they would pay $10,364 in income taxes.

Right side, If a married couple was not working and had money in a normal, after-tax brokerage account, they could make $75,299 and pay $0 in taxes.

When I really understood the chart above, it was a real eye opener.  I simply don’t understand why this kind of information is not taught to everyone and in a simple manner, in high school.

If you would like to see someone who has been doing this for a few years, check out, Never Pay Taxes Again.   He puts his family’s tax returns online each year.  This site taught me a few things.

Thanks for stopping by and hope the post has been helpful.


Posted in Taxes | Leave a comment

401k vs. Roth 401k

One of the most important decisions you need to make is whether to put your retirement money into a Roth or a Traditional 401k.  The decision is a personal one depending on your view on taxes.  On the traditional 401k, you get a tax break now, but pay regular in tax rates when you withdrawal.   On the Roth 401k, you don’t get a tax break now, but pay no tax when you withdrawal.   Take a look at the comparison table below.

I’d personally rather pay the $25 now per $100 invested (Roth) than pay $400 later per $100 invested (Traditional).

The Roth has another advantage, no Required Minimum Distributions (RMD) in your lifetime.  On the traditional 401k, you have to start taking RMD’s at 70 1/2.  The government wants that tax revenue.  In english, this means under the Roth, I never have to take any distributions in my lifetime.  I can pass all of the money in the Roth to my kids tax free to them and they don’t pay taxes when they pull from my Roth.  It is a huge consideration if you want to keep wealth in your family and not give it to the government.  I know I do.

I have been putting money into the Roth since my company starting matching on the Roth in 2016 and will continue to do so.  I stopped putting money into the traditional 401k altogether.

What is the ‘Rule Of 72’
The rule of 72 is a shortcut to estimate the number of years required to double your money at a given annual rate of return. The rule states that you divide the rate, expressed as a percentage, into 72:

Formula:  Years required to double investment = 72 ÷ compound annual interest rate

http://www.investopedia.com/terms/r/ruleof72.asp

Thanks for stopping by and hope the post has been helpful.

Posted in Investing | 4 Comments

Hope, Freedom, and Dreams

I hope everyone learns how to get better with managing their finances.
I hope everyone achieves Financial Independence as early as possible.

I hope everyone gets wealthy.

I hope everyone’s fears begin to diminish.  Fear of losing a job, fear of not having enough for their families.  These need to go away.

I hope everyone has enough wealth to do the work they love and pursue their passions.

I hope everyone has more freedom and time for their families.

Think about what you love to do. What you would do if money was not a concern. You know what I’m talking about, where you lose track of time, stay up later than you should, and have more energy after working on it.  You’d even do it for free.

That’s what you should be doing.

That’s the what the world needs you to do.

That’s when the world starts to become a better place.

I will show you exactly how my family is getting to Financial Independence and how you can do it.  It is not complicated, but it is not easy.

Let’s get you in a place of Financial Independence. A place full of hope, freedom, dreams, and completely free from fear.

I want you to find your hope, freedom, and pursue your dreams for you and your family.

Thanks for stopping by and hope the post has been helpful.

Posted in Uncategorized | Leave a comment

I Got A 5.7% Raise Last Week

The main purpose of this post is to show you what a dividend increase looks like using a real wold example.  The numbers for my position in Coca-Cola are not mind blowing, but can be if the number of shares are scaled up.

Coca-Cola raised their annual dividend 8 cents or 5.7%.  The annual payout in 2016 was $1.40 per share. After the increase, the annual payout in 2017 was $1.48 per share.  8 cents  per share might not sounds like a lot, but it can be depending on how many shares you have.  I currently have 460 shares of KO.

Here’s what my numbers look like before and after the increase:
2016 – 460 x $1.40 = $644
2017 – 460 x $1.48 = $680.80

Using my portfolio, I will get $36.80 more of income after the increase.  $36.80 is not going to change my family’s lifestyle, but over time with more dividend increases, buying more shares and dividend reinvestment, the amount of dividend income becomes more impressive.


The chart above shows KO’s dividend history since 2009.  Let’s look at KO’ dividend increase history and run another example.  For simplicity sake I will use the same 460 share number I used above.
2009 – 460 x $0.82 = $377.20
2017 – 460 x $1.48 = $680.80

In this example, I would be making $303.60 more than I did in 2009.  Almost double the amount of income in 8 years.  I don’t know too many people who are making double at their day jobs than what they were making in 2009.  And you are in complete control of your dividend income.

If you want to run your own scenarios or dream a little, head over to this tool and put your own numbers in.  For the scenario in this post, I would use $680.80 for the “Beginning Annual Dividends” and 5.7 for “Annual Dividend Percent Increase”.  I always use 100 for “Number of Years” since I like to see what my grandkids will have.

I understand that dividends can get cut, but you dramatically reduce that risk by sticking with the Dividend Aristocrats.  The Dividend Aristocrats also beat the S&P 500 index in rate of return as well.  In English, the Dividend Aristocrats are paying you cash every quarter and grow faster (appreciate) than the S&P 500.  It’s an awesome combination and I have seen it  personally in my own portfolio.

Thanks for stopping by and hope the post has been helpful.

Posted in Dividends | Leave a comment

The Importance Of Rate Return

Rate of return is the most important item to get really wealthy.  There is so much focus on budgeting and spending less than you make in the personal finance industry.  You do have to live on less than you make so you have something to save, but you don’t have to make yourself miserable.  I firmly believe that the journey is very important.  My wife and I don’t want to save everything to be rich later and not enjoy our lives now.

To illustrate the importance of rate of return, I built a spreadsheet that compares the growth of savings using 3 different rates of return, a Target Date Fund, the S&P 500, and my (FI Warrior’s) rate of return.  I used the most recent 5 year for all three.  I only have 5 years of data on myself and I wanted to be fair.  I chose a Target Date Fund since most people have those in their 401k’s and they suck.  Target Date funds routinely perform worse the the stock market average.  The S&P 500 is the benchmark everyone gets measure against.  A lot of people of those in their 401k’s too.  An S&P 500 index is a decent option.  I have the ability to do a “self directed” 401k.   This means I can buy individual stocks or any mutual funds that Charles Schwab offers.  Not many people have this option in their 401k, but if you do have it, get into it.  Today.  I was not able to get into it until early 2012 and you can see my portfolio take off in the graph at the top of the page.

For savings amount, I chose $1,200 per year.  That is only $100 per month.  You can change this yourself if you download a copy of the spreadsheet.  I put in $18,000 a year since that is the IRS maximum for 401k’s in 2017.

I also run the numbers out 100 years because it is important for us to build and leave a legacy for our grandkids.  The link to download your own copy of the spreadsheet is at the bottom of the table.  You can tweak the gray cells with your own numbers if you don’t like the assumptions I use in this post.

Let’s highlight a couple points in time from the spreadsheet so you can really see the importance of the rate of return using a couple key points in time.

Save $1,200 a year from Age 25 to 65.  For year 82, I used, grandkids are born at my age 60 and amount it is worth when the grandkids are 46 years old, my current age.  A fun little what if scenario for me.

Save $18,000 a year from Age 25 to 65. For year 82, I used, grandkids are born at my age 60 and amount it is worth when the grandkids are 46 years old, my current age.  A fun little what if scenario for me.

Rate of return on investments is extremely important, but does not get as much attention as it should.  Most of the focus is around budgeting and deprivation to become wealthy.  Spend a little time getting educated on investing to increase rate of return and enjoy the journey of life.

Thanks for stopping by and hope the post has been helpful.

Posted in Dividends, Investing, Stocks | 2 Comments

Don’t kill the hen that lays the golden eggs

A lot of us have heard this story since we were kids and here is a refresher.

A man had a hen that laid a golden egg for him each and every day. The man was not satisfied with this daily profit, and instead he foolishly grasped for more. Expecting to find a treasure inside, the man slaughtered the hen. When he found that the hen did not have a treasure inside her after all, he remarked to himself, ‘While chasing after hopes of a treasure, I lost the profit I held in my hands!’

How does this relate to Financial Independence?
Dividend stock = Hen
Dividend Payments = golden eggs

When you own good quality dividend stocks, they pay out a portion of their profits in the form of dividends. Most companies pay them out every three months or quarterly. Great companies have a long track record of paying and increasing their dividends annually. These companies are known as the Dividend Aristocrats.

Main purpose is for your money to earn more money forever. If you sell your stock for capital gains (kill the hen), then you loose the ability for the stock to pay you ever increasing dividends (golden eggs). Once you sell the stock, it’s gone and no longer produces income.

Would you rather have capital gains to buy something like a house or car or would you rather have increasing income coming in to your bills forever?

My goal is to figure out how to get more hens laying more and more golden eggs.

Thanks for stopping by and hope the post has been helpful.

Posted in Dividends, Financial Independence | 2 Comments

Any Monkey Can Beat The Market

I am linking to a couple articles for you to read.  The articles will show you how poorly the financial industry/experts are at beating the market.  I wish these types of article/stories made the major news cycle every year.  With a little bit of knowledge, you will easily be able to beat the market, earn great returns, and not pay fees to the financial industry for their sub par performance.

Monkeys Beat the Market

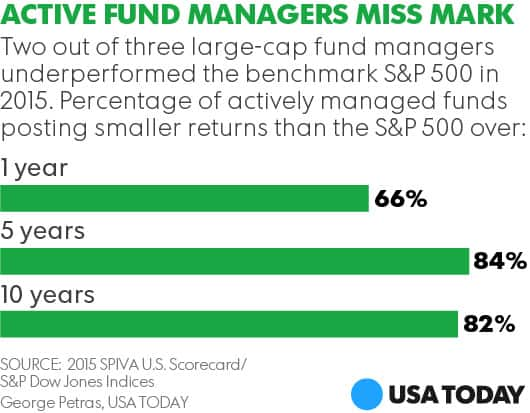
Excerpt – “Give a monkey enough darts and they’ll beat the market. So says a draft article by Research Affiliateshighlighting the simulated results of 100 monkeys throwing darts at the stock pages in a newspaper. The average monkey outperformed the index by an average of 1.7 percent per year since 1964. That’s a lot of bananas!”


84% of large-cap funds generating lower returns than the S&P 500 in the latest five-year period

Excerpt – “That hot-shot mutual fund manager you’re betting on to make you rich might be generating returns that fall far short of the benchmark
stock index the fund tracks.  The longer-term outlook is just as gloomy, with 84% of large-cap funds generating lower returns than the S&P 500 in the latest five-year period and 82% falling shy in the past 10 years, the study found.”

Wait, a monkey throwing darts to pick stocks  outperformed the S&P 500 by 1.7% and beat 84% of the “experts” since 1964?  Yep.  Just buy an S&P 500 index fund and you’ll beat 84% of the “experts”.  There is no way I’m paying the experts 1% of my portfolio to not beat a monkey.  I’m also not going to listen to any of their picks either.

If anyone tells you they can predict how the stock market is going to do in the future, run away, go buy a monkey, darts, and the stock pages for the monkey to throw darts at.  You will pay way less in fees and beat 84% of all the experts charging you to earn you less money.

Thanks for stopping by and hope the post has been helpful.


Posted in Investing, Stocks | Leave a comment

Protect Yourself

Today I am going to talk about the tool I mentioned last week in my January Portfolio update.  I use it so I don’t lose too much money.  The tool is the “Trailing Stop Sell” order.  I have Trailing stop sell orders on all my stocks in all my accounts.

Protecting losses:
I put Trailing Stop Sell orders in place immediately after I buy a stock.  So if a stock goes down immediately after I buy it, I will only lose the amount I chose to.  I usually set mine between 5-10%.

Protecting Gains:
The nice thing about the Trailing Stop Sell orders is that it also protects gains as well.  The same order I put in right after buying will still be in effect if a stock goes up past where I bought it.  When the price of the stock moves up, the sell price moves up too.  It adjusts automatically and by the minute when the stock market is open.   Once the stock hits a new high, a new sell price gets set.  The sell price will be based on that new high even it takes several days, weeks, months to go low enough to hit my 5% trailing stop sell order price.

There is a lot on the screen above.  Let’s look at the important part for setting up the order on the screenshot below.

Action: Sell.  I set it to sell all the shares of ABBV in the account
Quantity: Number of shares you want to sell.  You don’t have to sell all shares.
Venue: Smart.  Unique name to Schwab.
Order Type: Trailing Stop
Trailing amount:  This is the amount you are willing to let the stock pull back from its high.  I chose 5%.  % is in the next choice box.  I could have also selected a $ amount.
Timing: GTC which means “Good Til Cancelled”.  My trailing stop limit will stay in effect until I cancel it.
Click Review button to review the order.  And OK on the next screen.

That’s it.  I now have a Trailing Stop Sell in place in this account for 26 shares of ABBV.

Here is what the screen looks like now.

Here is the important part of the screen.

The first order in the list is the Trailing Stop Sell I just created for ABBV. The Trigger Value column shows the price when I placed the order minus my 5% trailing stop or $57.74.  ABBV was trading at $60.78 when I placed the order.

Here is what the same order looks like about a week later.
ABBV must have gone up a little since my Trigger Value moved up a little to $57.96. I did not have to do anything else, the Trigger Value just moved up since the stock moved up at some point.

Once in place, these orders are automatic and take the emotion out of the stock market.  Like I mentioned in my other post, you can even be out of the country and completely disconnected and the order will execute.


I was here when one of my sell orders automatically executed. I did not know everything sold off until I got back in the US and had cellular coverage. Pretty awesome.

Thanks for stopping by and hope the post has been helpful.

Posted in Investing | 2 Comments

Dividend Income Update – February 2017

Before we get too far along in the year, I wanted to establish as starting point for my dividend income.  As the year(s) go by,  I can provide updates and explain why it is increasing.

There are three reasons dividend income increases:
– Investing more money and buying more shares
– Dividend reinvestment
– Annual Dividend Increases

Annual Dividend Increases is my favorite reason.  I get an income raise and I’m not investing any more capital or reinvesting dividends. High quality stocks with a commitment to paying dividends will increase their dividends once a year. In my experience, the biggest income raise comes from the increase in dividends per share.  After all, I can only save so much money to buy more shares.


My dividend income in 2016 was $27,019 or $2,251.58 monthly.


So far in 2017 I have increased my dividend income by:
– Purchasing 460 shares of Coca-Cola, $640 in annual income
– Purchasing 407 shares of AbbVie, $1,041.92 in annual income
– Reinvesting dividends from Altria to purchase 93 shares, $226 in annual income
– Sold off MRK in 2016 and COP in 2017. That explains the math difference.

The math for annual dividend income is straight forward.
Shares owned x Annual Dividend per share = Annual Dividend Income

I always like to look at my dividend income in monthly terms for two reasons:
– I think about my salary income monthly terms
– I pay my bills monthly

The goal is to be able to pay all my monthly bills with dividend income. Dividend income is passive income and passive income is the key to Financial Independence.

If you want to see how Dividend Income can grow over time, take a look at my Estimate Compounding Of Dividend Income Tool.  My numbers would look like this:

The 8% for Annual Dividend increase only factors in the stock raising its annual dividend.  Over the last 5 years if include buying more shares and dividend reinvestment, that 8% number is actually closer to 14%.  Plug 14% in there, the dividend income builds very quickly.

Why do you use 100 years?  I am 46 today.  I know I’ll be dead, but I have kids and some day they will have kids, my grandkids.  I want to leave a legacy for my family.  I want them to never ever have to worry about money and be able to pursue work they truly enjoy.  How awesome would it be for the grandkids to start with dividend income around year 35?

Proverbs 13:22 states:
“A good person leaves an inheritance for their children’s children, but a sinner’s wealth is stored up for the righteous.”

Thanks for stopping by and hope the post has been helpful.

Posted in Dividends | 5 Comments

What is this?

“What is this?” is exactly what I thought when I saw ABBV sitting as one of the top 3 CAGR’s when I was doing an analysis of the Dividend Aristocrats with my Crush the Market Tool.  ABBV had a 19% CAGR over its lifetime and a 4.19% dividend yield at the time of my investigation.  I already have a lot of Altria which is number 2.

AbbVie is in the biotech sector and a spin-off from Abbott Laboratories.  Its most famous drug is Humira.  Abbott Laboratories was the number 2 Dividend Aristocrat behind Altria (MO) in Jeremy Siegel’s book, The Future For Investors.

I bought some AbbVie (ABBV) stock on Wednesday.  I had a buy stop limit order on it so if it kept going down, I could buy cheaper and if it went up 2% my order would trigger.  It triggered.

Why did I buy AbbVie?
– It’s a Dividend Aristocrat
– ABBV’s current dividend yield of 4.27% is 2.27% higher than its 5 year average yield of 2.00%.  A better way to look at it is (4.27-2.00)/2.o = 113.5% higher yield than 5 year average.
– ABBV just raised its dividend from $2.28 annually to $2.56 annually.  That is a 12.28% increase.  Here’s the math:  (2.56-2.28)/2.28 = 12.28%.

The biggest reason I bought this stock:
The more than double the 5 year average dividend yield.

The 51 shares of ABBV  will add $130.56 of annual dividend income for me.  I might buy some more.

Below are the two charts I looked at when making the purchase decision. All the numbers I mention above are there.  You can see in the “Growth of $10,ooo Investment” chart below that ABBV has outperformed the S&P 500 (Orange line) since ABBV was spun out of Abbott Labs.

Growth of $10,ooo Investment Chart:

Dividend Chart:

Thanks for stopping by and hope the post has been helpful.

Posted in Dividends, Investing, Stocks | Leave a comment

StockWatch

It’s another fun tool that visualizes what happens to a $1,000 if invested over the 10 year time frame. StockWatch was created by the same guy who created StockChocker.  As time and the animation progresses, fun facts are added underneath.  Sometimes during the course of a day or week, I still get caught up on what is happening to a stock now.  Watching these play out makes me to remember to think long term.

This particular StockWatch reaffirms my Dividend Aristocrat investing approach. Microsoft had an early lead but was over taken over due to a shift in technology and the iPod/iPhone.  In The Future for Investors by Jeremy Siegel, he warns us to stay away from these shiny tech stocks.  The main reason to stay away from the shiny, tech stocks is the fact that they can be replaced fairly quickly by shifts in technology.   It’s much harder for a consumer staple company with a strong brand like Coca-Cola or Marlboro to be replaced quickly.  Also, in sub par or flat rate or return years, at least you are getting dividend income.  And if you are reinvesting that dividend income when a stock is not returning well, you are buying more of the stock with dividend reinvestment since it is cheaper.

Be sure to check out some of the other StockWatches.  They are fun too.

Have a great weekend!

Thanks for stopping by and hope the post has been helpful.

Posted in Investing, Stocks | 2 Comments

Have a Coke and a Smile…….


I bought some Coca-Cola (KO) stock on Tuesday.  I had a buy stop limit order on it so if it kept going down, I could buy cheaper and if it went up 2% my order would trigger.  It triggered.

Why did I buy Coca-Cola?
– It’s a Dividend Aristocrat
– It’s near it’s 52 week low of $41.90.  Looks like I bought it lower than 52 week low at $41.5157.
– KO’s current dividend yield of 3.34% is almost .77% higher than it’s 5 year average yield of 2.57%.  A better way to look at it is (3.34-2.57)/2.57 = 29.96% higher yield than 5 year average.
– It’s due for a dividend raise on the next dividend declaration day. That will make the dividend yield for me every higher.
– It’s a well run company with one of the best known brands in the world.

The biggest reason I bought this stock:
It’s on sale. Attention Kmart shoppers, the blue light is on!

The KO purchase will add $644 of annual dividend income for my family.  And we should see a dividend raise announced around 2/18/2017 since KO is a Dividend Aristocrat.

Below is the only chart I looked at when making the purchase decision. All the numbers I mention above are there.

Thanks for stopping by and hope the post has been helpful.

Posted in Dividends, Investing, Stocks | Leave a comment